
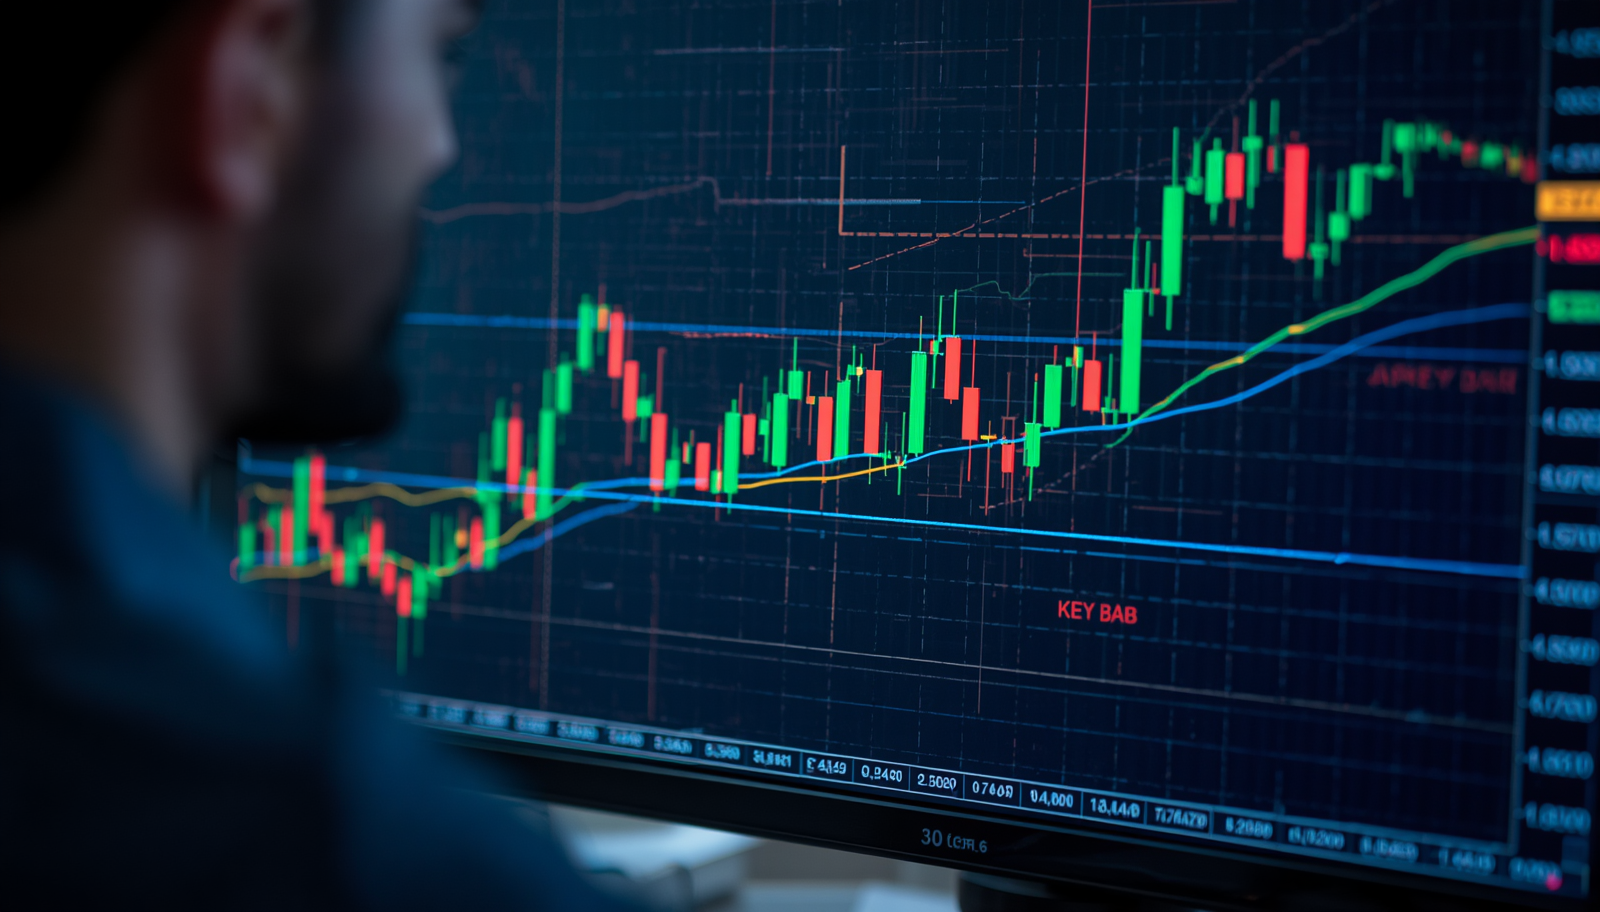
While many trading strategies depend on a long list of technical indicators, price action trading takes a much simpler approach. Instead of filling a chart with different signals, traders focus primarily on the movement of price itself.
Every candle, swing, breakout, and trend provides information about the ongoing struggle between buyers and sellers. Learning how to interpret that information can help traders understand what is happening in the market without making their charts unnecessarily complicated.
In 2026, financial markets are faster and more data-driven than ever, yet price action remains popular among traders who value a clean and flexible approach. It can be used in forex, stocks, cryptocurrencies, commodities, indices, and other markets.
This guide explains how price action trading works, the patterns traders commonly watch, its advantages and limitations, and how beginners can start developing their own price action strategy.
What Is Price Action Trading?
Price action trading is a method of analyzing markets by focusing primarily on historical and current price movements.
Rather than depending heavily on technical indicators, traders study the raw price chart. They look at market structure, trends, support and resistance, candlestick formations, breakouts, and pullbacks to understand what buyers and sellers are doing.
The basic idea is straightforward: price reflects the combined decisions and expectations of market participants. By studying how price behaves, traders can gain insight into market sentiment and identify potential trading opportunities.
Price action does not predict the future with certainty. Instead, it helps traders recognize situations where one market outcome may be more likely than another.
Why Price Action Trading Is Popular
One of the biggest attractions of price action trading is its simplicity.
A chart overloaded with indicators can sometimes create more confusion than clarity. Different indicators may produce conflicting signals, leaving traders unsure about what to do.
Price action traders generally focus on the market itself. They observe how price reacts to important levels and how market structure develops over time.
Another advantage is flexibility. The same basic principles can be applied to different markets and time frames, making price action useful for scalpers, day traders, swing traders, and longer-term investors.
How Price Action Reflects Market Psychology
Price movement is ultimately driven by the decisions of market participants.
When buying pressure becomes stronger than selling pressure, prices tend to rise. When sellers become more aggressive, prices can fall.
These changes are visible on a price chart.
A series of strong bullish candles may indicate increasing buying interest, while repeated rejection from a resistance area can suggest that sellers are becoming active.
By learning to recognize these behaviors, traders can develop a better understanding of market psychology instead of simply reacting to indicator signals.
The Importance of Candlestick Charts
Candlestick charts are one of the most important tools in price action trading.
Each candle provides four key pieces of information: the opening price, closing price, highest price, and lowest price during a specific period.
The shape and size of a candle can reveal useful information about market sentiment.
For example, a large bullish candle may show strong buying pressure, while a large bearish candle can indicate aggressive selling.
Long wicks may reveal that price moved in one direction but was rejected before the candle closed. These small details can help traders understand the battle between buyers and sellers.
Understanding Market Structure
Market structure describes how price moves from one high or low to another.
An uptrend generally consists of higher highs and higher lows, showing that buyers are maintaining control.
A downtrend develops through lower highs and lower lows, indicating stronger selling pressure.
A sideways market occurs when price remains within a relatively defined range without creating a clear upward or downward trend.
Understanding this structure is important because it gives traders a broader context for individual setups. A bullish candlestick pattern may carry a different meaning in a strong downtrend than it would near an important support level during an established uptrend.
Support and Resistance
Support and resistance are fundamental parts of price action analysis.
Support is an area where buying pressure has previously helped stop or slow a decline. Resistance is an area where selling pressure has repeatedly limited an upward move.
These levels are important because traders often pay attention to places where price has reacted strongly in the past.
When price approaches support, traders may watch for signs that buyers are returning. Near resistance, they may look for evidence that sellers are becoming active.
Support and resistance are not always exact prices. They are often better viewed as zones where the market may react.
Trend Lines
Trend lines provide a simple visual way to follow market direction.
During an uptrend, traders can connect a series of higher lows to create an ascending trend line. During a downtrend, lower highs can be connected to create a descending trend line.
Trend lines can help highlight areas where price may find temporary support or resistance.
However, traders should avoid treating them as perfect boundaries. Markets can temporarily move through a trend line or completely change direction as conditions evolve.
Breakouts and Breakdowns
Breakouts are closely watched by price action traders.
A breakout happens when price moves above a significant resistance area, while a breakdown occurs when price falls below an important support area.
A strong breakout can indicate that the previous balance between buyers and sellers has shifted. However, not every breakout leads to a lasting trend.
False breakouts occur when price moves beyond a key level and then quickly returns to the previous range.
For this reason, many traders wait for additional confirmation before entering a breakout trade. They may look at the closing candle, subsequent price action, or other market factors before committing capital.
Pullbacks
Markets rarely move in a perfectly straight line.
Even during a strong uptrend, price may temporarily decline before continuing higher. This temporary move against the main trend is known as a pullback.
In an uptrend, traders may look for a pullback toward a previous support area before considering a long position.
In a downtrend, a temporary upward move toward resistance may provide a potential selling opportunity.
Waiting for a pullback can help traders avoid chasing a market after a large price movement and may provide more favorable entry conditions.
Important Candlestick Patterns
Several candlestick formations are commonly used in price action analysis.
A bullish engulfing pattern can indicate that buying pressure is increasing after a decline.
A bearish engulfing pattern may suggest that sellers are becoming more aggressive following an upward move.
A doji forms when opening and closing prices are relatively close together. It often reflects uncertainty or a temporary balance between buyers and sellers.
A hammer can appear after a decline and may signal a possible bullish reversal, especially when it develops around an important support zone.
A shooting star can appear after an upward move and may indicate that buyers are losing control.
These patterns should not be treated as automatic buy or sell signals. Their significance depends heavily on where they appear and what the broader market is doing.
Price Action and Trading Volume
Volume can provide additional context for price movements.
For example, a breakout accompanied by strong trading activity may suggest greater participation than a breakout occurring on unusually low volume.
Increasing volume during a trend can support the idea that market participation is growing.
On the other hand, weakening volume may sometimes indicate that momentum is fading.
Volume should always be interpreted according to the market being traded. Stock and futures markets provide centralized volume data, while forex traders often work with tick volume because the currency market is decentralized.
Multiple Time Frame Analysis
Looking at more than one chart time frame can give traders a broader understanding of market conditions.
A higher time frame can reveal the primary trend and major market structure.
A medium time frame can help identify important support and resistance zones.
A lower time frame can then be used to refine a potential entry.
For example, a trader might identify an uptrend on the daily chart, find a support area on the four-hour chart, and then wait for a bullish price action setup on the one-hour chart.
This approach can help traders avoid taking short-term trades that conflict with the larger market direction.
Risk Management in Price Action Trading
No trading method wins every time, and price action is no exception.
Risk management should therefore be an essential part of every strategy.
Stop-loss levels should be placed in logical locations based on market structure rather than chosen randomly. For example, a trader might place a stop beyond a recent swing high or low, depending on the setup.
Position size should also reflect the amount of capital the trader is willing to risk.
The goal is to keep individual losses manageable so that a series of unsuccessful trades does not seriously damage the trading account.
Advantages of Price Action Trading
Price action offers several potential benefits.
It keeps charts relatively simple and focuses attention on actual market behavior.
The same principles can be applied across forex, stocks, commodities, cryptocurrencies, and indices.
Because traders observe price directly rather than waiting for indicators to react, they may be able to recognize certain market changes earlier.
Price action also encourages traders to understand market psychology, structure, momentum, and supply and demand rather than simply memorizing indicator settings.
Limitations of Price Action Trading
Price action is useful, but it is not a perfect system.
Reading charts requires experience. Two traders can look at the same setup and reach different conclusions based on their interpretation of the market.
False breakouts, unexpected news, sudden volatility, and changing liquidity can also make price action signals unreliable.
Another challenge is that price action can become subjective if traders do not have clear rules.
The solution is not to abandon price action but to combine it with a structured strategy, appropriate risk management, and consistent decision-making.
Common Beginner Mistakes
New traders often make the mistake of trying to analyze every small movement on a chart.
Instead of focusing on meaningful market structure, they may react to every candle and enter too many trades.
Another common mistake is relying on one candlestick pattern without considering the bigger picture. A bullish candle by itself does not necessarily mean the market will rise.
Entering trades without confirmation and ignoring stop-loss levels can also create unnecessary losses.
Some traders give up on their strategy after experiencing a few losing trades. A strategy should be evaluated over a meaningful number of trades rather than judged from one or two results.
Patience and consistency are essential.
How to Practice Price Action Trading
Developing strong price action skills takes practice.
Beginners can start by studying historical charts and marking important support and resistance areas. Look for trends, breakouts, pullbacks, and recurring candlestick formations.
A demo account can be useful for practicing trades without immediately putting real capital at risk.
Keeping a trading journal is another valuable habit. Record the setup, entry, stop-loss, target, reasoning, and outcome of each trade.
Over time, reviewing this information can help you identify which setups perform well and which mistakes appear repeatedly.
The objective is to develop the ability to read charts consistently rather than memorize a long list of patterns.
The Future of Price Action Trading
Financial markets are becoming increasingly influenced by artificial intelligence, machine learning, automation, and advanced data analysis.
These technologies can process enormous amounts of information and help traders identify patterns more quickly.
Some modern trading systems already combine automated analysis with traditional price action concepts.
Despite these developments, the basic forces behind price movement have not disappeared. Buyers and sellers still make decisions based on expectations, fear, greed, economic conditions, and changing information.
That is why understanding price behavior remains relevant in 2026 and is likely to remain useful as financial technology continues to evolve.