
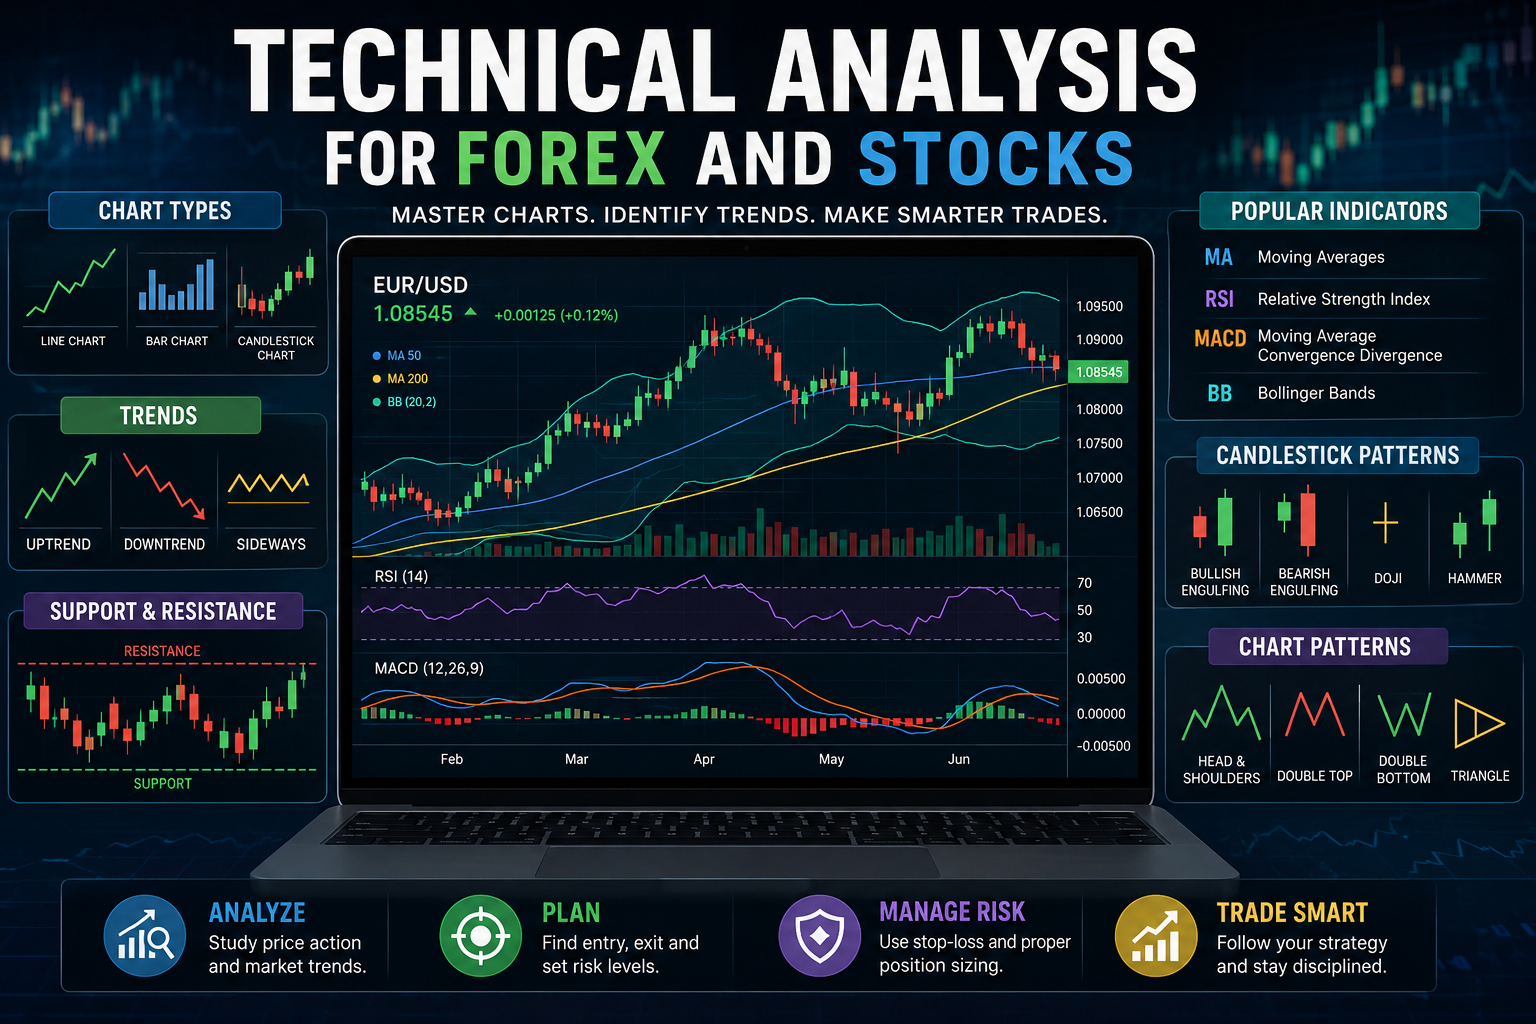
Many traders spend countless hours studying technical indicators and trading strategies but overlook one of the most important factors: the chart time frame. The same strategy can deliver very different results depending on whether it is used on a five-minute chart, a one-hour chart, or a daily chart.
The forex market operates 24 hours a day, five days a week, which creates constant price movement across different time frames. A day trader searching for quick opportunities has very different needs from a trader who wants to hold positions for weeks or months. Choosing the right chart time frame can therefore make a major difference in how you analyze the market and manage trades.
There is no universal time frame that works for every trader. Your ideal choice depends on your trading style, goals, available time, experience, and comfort with risk. Once you understand how different time frames behave, it becomes easier to build a trading approach that feels more structured and manageable.
This guide explores the main forex time frames, explains how traders use them, and shows beginners how to find an interval that fits their trading style.
What Is a Forex Time Frame?
A forex time frame tells you how much market activity is represented by each candlestick or price bar on a chart.
For example, every candle on a one-minute chart represents one minute of price movement. On a one-hour chart, each candle covers one hour. A daily chart compresses an entire trading day into a single candle, while a weekly chart summarizes price activity over a full week.
The shorter the time frame, the more detailed the price movement appears. Longer time frames remove much of that short-term noise and make broader market trends easier to see.
Understanding this difference is important because the market can look completely different depending on the chart you are watching.
Why Forex Time Frames Matter
Your chart time frame influences almost every part of a trade, from identifying trends to finding entries and placing stop-loss orders.
A very short-term chart can show dozens of price movements within a few hours. While this creates plenty of opportunities, it can also produce false signals and make it difficult to distinguish meaningful trends from temporary fluctuations.
Longer time frames provide a wider perspective. Short-lived price movements become less important, allowing major trends, support and resistance areas, and significant market structures to stand out more clearly.
This is why experienced traders often look at more than one time frame before entering a position. A broader chart can reveal the overall direction, while a lower chart can help with entry timing.
Understanding the Main Forex Time Frames
Forex platforms offer a wide range of chart intervals. The most commonly used include one-minute, five-minute, fifteen-minute, thirty-minute, one-hour, four-hour, daily, weekly, and monthly charts.
Each one has a different purpose and tends to suit a particular trading style.
One-Minute Chart
The one-minute chart is primarily used by scalpers and extremely active traders who attempt to capture very small price movements.
Because a new candle forms every minute, the market can appear extremely fast. Traders need to make decisions quickly and remain focused on price action.
The main advantage is the large number of potential setups. The downside is that these charts contain considerable market noise. Small price fluctuations can trigger signals that have little importance from a broader market perspective.
For beginners, the one-minute chart is usually difficult to manage because the rapid pace can encourage impulsive decisions and emotional trading.
Five-Minute Chart
The five-minute chart is a popular choice among active day traders. It provides more information than a one-minute chart while reducing some of the noise associated with extremely short intervals.
Traders can use this chart to study candlestick patterns, support and resistance, trends, and technical indicators. It can also provide several potential setups during an active trading session.
Some experienced traders use higher time frames to determine market direction and then switch to the five-minute chart to look for more precise entries.
Fifteen-Minute Chart
The fifteen-minute chart offers a useful middle ground between speed and clarity.
Day traders often use it to identify intraday trends without dealing with as much noise as they would encounter on a one-minute or five-minute chart.
Price structures tend to be easier to recognize, and traders have more time to evaluate a setup before making a decision. For beginners who want to explore intraday trading, the fifteen-minute chart can be easier to manage than extremely short-term intervals.
Thirty-Minute Chart
The thirty-minute chart gives traders a broader view of intraday price action while still providing enough detail for shorter-term strategies.
It can be useful for spotting developing trends, key price levels, and changes in market momentum. Some traders combine it with a lower time frame to refine their entries.
This interval can be particularly useful for traders who want more market context without moving completely into longer-term trading.
One-Hour Chart
The one-hour chart is one of the most versatile options in forex trading.
It can work well for day traders, as well as traders who hold positions for longer periods. Since each candle represents an hour of market activity, short-lived fluctuations have less influence on the overall picture.
The one-hour chart can make trend direction, support and resistance, and price patterns easier to identify.
For beginners, it can be an excellent starting point because it offers enough trading opportunities without requiring constant attention to rapidly changing prices.
Four-Hour Chart
The four-hour chart is widely used by swing traders.
Each candle represents four hours of price activity, allowing traders to see larger market movements while filtering out much of the noise found on lower time frames.
Because setups generally take longer to develop, traders do not need to watch the market every minute. This makes the four-hour chart attractive to people who have other responsibilities during the day.
It is also commonly used alongside the daily chart to identify broader trends and important market levels.
Daily Chart
The daily chart provides a much clearer picture of the broader market.
Each candle represents one trading day, making it easier to identify major trends, important support and resistance zones, and significant price reversals.
Longer-term traders often rely heavily on daily charts because they are less affected by temporary intraday fluctuations. Instead of reacting to every small price movement, traders can focus on the larger market structure.
The downside is that fewer trading opportunities may appear compared with lower time frames. However, the setups that do develop can provide stronger market context.
Weekly Chart
The weekly chart takes an even broader view of the forex market.
It is useful for identifying major long-term trends, historical price levels, and significant market reversals. Traders who focus on shorter time frames may still use weekly charts to understand the bigger picture before making an intraday or swing trade.
A weekly chart is generally not used for precise entry timing. Instead, it helps traders understand where the market currently stands within a much larger trend.
Monthly Chart
The monthly chart provides the widest perspective commonly used by forex traders.
Each candle represents an entire month, allowing traders to study long-term trends and major market cycles. Investors and position traders can use these charts to understand how currencies have behaved over extended periods.
Monthly charts are not generally practical for precise entries, but they can provide valuable context when evaluating long-term market direction.
Matching Time Frames With Trading Styles
Your trading style should have a major influence on the time frame you choose.
Scalpers typically focus on one-minute and five-minute charts because they aim to capture small price movements within a short period.
Day traders often work with five-minute, fifteen-minute, thirty-minute, and one-hour charts. Their positions are usually opened and closed within the same trading day.
Swing traders commonly prefer four-hour and daily charts because they are looking for larger moves that may take several days or weeks to develop.
Position traders usually focus on daily, weekly, and monthly charts because their trades can remain open for weeks or even months.
The goal is not to find the “perfect” time frame. Instead, choose an interval that fits your strategy, schedule, and ability to manage risk.
Using Multiple Time Frame Analysis
Relying on a single chart can sometimes give you an incomplete view of the market. Multiple time frame analysis solves this problem by combining different chart intervals.
For example, a trader might begin with a daily chart to identify the overall market trend. The four-hour chart can then be used to locate important support and resistance areas, while the one-hour chart can help identify a potential entry.
This approach allows traders to connect the bigger picture with short-term price action.
Suppose the daily chart shows a clear upward trend. If the four-hour chart also supports that direction and the one-hour chart provides a suitable entry setup, the trade may have stronger alignment than a setup identified solely on a five-minute chart.
Multiple time frame analysis does not guarantee profitable trades, but it can help traders avoid making decisions based only on short-term market noise.
Choosing a Time Frame as a Beginner
New traders often feel tempted to start with the shortest chart because it appears to offer more opportunities. In reality, faster charts can make learning more difficult.
One-hour and four-hour charts are often more manageable for beginners because price movements develop more slowly and there is less pressure to make instant decisions.
Higher time frames can also encourage patience. Instead of reacting to every small candle, beginners have more time to analyze the market, consider risk, and decide whether a setup actually fits their strategy.
Once you become more experienced, you can experiment with shorter intervals if your trading style requires them.
Common Time Frame Mistakes
One of the biggest mistakes beginners make is constantly switching between time frames.
A trader might see a setup on a five-minute chart, become uncertain after checking the fifteen-minute chart, and then change their opinion again after looking at the one-hour chart. This can create confusion and lead to emotional decisions.
Another mistake is trying to trade extremely short time frames without enough experience. Fast-moving charts require discipline, quick decision-making, and strong risk control.
Some traders also focus exclusively on a lower time frame and completely ignore the broader market trend. This can result in trades that appear attractive in the short term but go against the larger market direction.
Consistency is important. Choose time frames that fit your strategy and practice using them before making frequent changes.
Risk Management Across Different Time Frames
Risk management remains important regardless of which chart interval you use.
Shorter time frames often involve tighter stop-loss levels because trades are based on smaller price movements. However, the increased market noise can make these stops easier to trigger.
Longer time frames generally require wider stop-loss distances because normal price fluctuations can be larger. Traders may therefore need smaller position sizes to keep their overall risk under control.
Your position size should always be based on the amount you are prepared to lose, rather than simply how much profit you hope to make.
Protecting your trading capital should come before trying to maximize individual trade returns.
The Role of Technical Analysis
Technical analysis can be applied across almost every forex time frame.
Tools such as moving averages, trend lines, support and resistance, candlestick patterns, and momentum indicators can help traders study market behavior.
However, an indicator does not automatically become more reliable simply because it is used on a particular chart. Its usefulness depends on the overall strategy, market conditions, and how the trader interprets the signal.
Higher time frames can sometimes provide more meaningful context because they capture a larger amount of market activity. Combining indicators with price structure and multiple time frame analysis can provide a more balanced approach.
Technology and Modern Forex Trading
Modern trading platforms have made it much easier to compare different time frames and analyze markets from almost anywhere.
Advanced charting tools, automated pattern recognition, algorithmic systems, and other analytical technologies can help traders process large amounts of market information. Mobile trading apps also allow traders to monitor their positions while away from a desktop.
However, technology does not remove the need for sound decision-making. A sophisticated platform cannot compensate for poor risk management, an unsuitable strategy, or an inappropriate time frame.
Understanding market structure and knowing how different chart intervals behave remain essential skills. not about constantly searching for the perfect chart. It is about developing a consistent process, managing risk carefully, and using a time frame that allows you to make decisions without unnecessary pressure.