
One of the most useful skills a trader can develop is learning how to identify important price levels on a chart. Among the most widely used concepts in technical analysis are support and resistance.
These levels are not simply lines drawn across a chart. They represent areas where buyers and sellers have repeatedly influenced price. By studying them, traders can spot potential reversals, breakouts, entry opportunities, profit targets, and sensible areas for managing risk.
For beginners, understanding support and resistance provides a strong introduction to technical analysis. Even experienced traders continue to use these concepts as part of more advanced strategies.
This guide explains how support and resistance work, why they matter in cryptocurrency trading, and how traders can use them more effectively.
What Are Support and Resistance Levels?
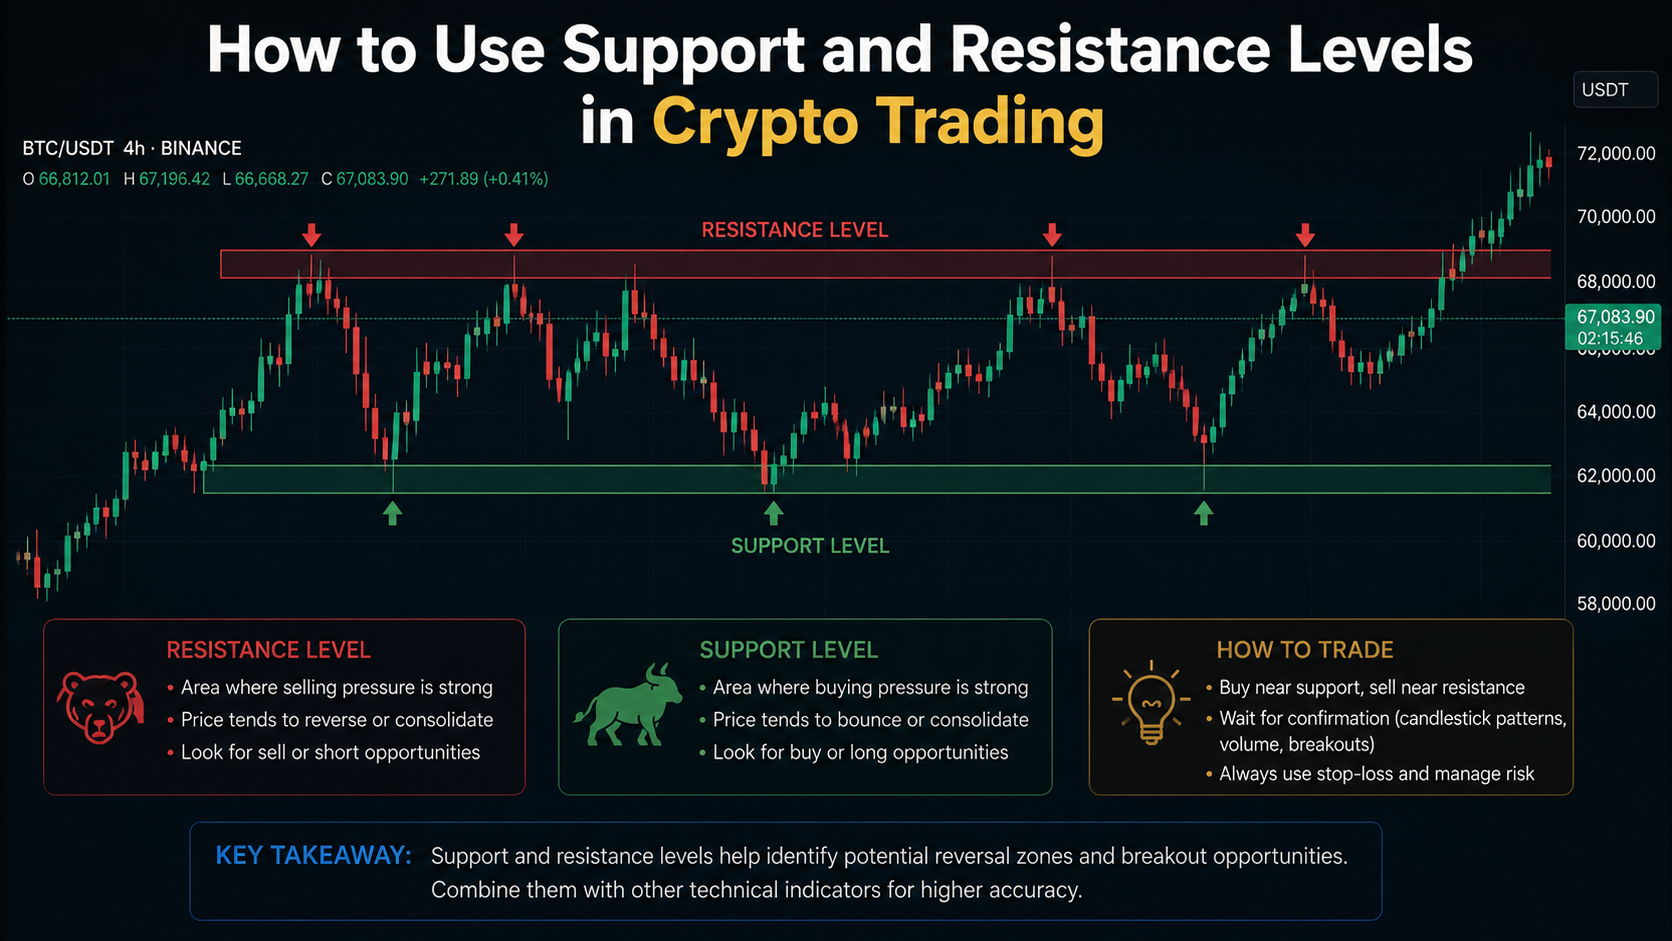
Support and resistance are price areas where the balance between buyers and sellers often changes.
Support is an area where buying pressure becomes strong enough to slow down or stop a decline. When a cryptocurrency approaches a previous support zone, some traders may consider the price attractive and begin buying, which can lead to a rebound.
Resistance works in the opposite way. It is an area where selling pressure has previously prevented prices from moving higher. As price approaches this zone again, traders may take profits or sell their positions, making it harder for the market to continue rising.
These levels often develop because traders remember previous price reactions. When similar prices are reached again, those past experiences can influence current buying and selling decisions.
Why Support and Resistance Matter
Support and resistance give traders a clearer framework for understanding price movement.
Instead of treating every price fluctuation as random, traders can focus on areas where the market has previously shown a strong reaction.
These levels can help answer several practical questions:
Where might it make sense to enter a trade?
Where could a trader take profits?
Where should a stop-loss be considered?
Is the market likely to continue in its current direction?
Could a reversal be developing?
Support and resistance become even more useful when combined with other technical and fundamental information.
Understanding Market Psychology
The importance of support and resistance is closely connected to investor psychology.
Imagine a cryptocurrency repeatedly falling to a certain price and then recovering. After seeing this happen several times, traders may begin to believe that buyers are likely to appear whenever the market reaches that area.
The same principle applies to resistance. If a cryptocurrency repeatedly reaches a certain price and then falls, traders may begin expecting sellers to become active there.
As more market participants watch the same levels, their trading decisions can reinforce the price zones.
This is one reason support and resistance can remain relevant even though market conditions are constantly changing.
How to Identify Support Levels
Support often develops around areas where previous declines ended and buyers pushed the price higher.
When studying a chart, look for places where price has fallen toward a particular area several times but failed to move significantly lower.
A level that has produced multiple strong reactions may carry more significance than one that has only been tested once.
Trading volume can provide additional information. Strong volume around a support zone may indicate that considerable buying activity is taking place.
It’s also important to remember that support is usually an area, not an exact number. Price may move slightly below or above the level before buyers step in.
How to Identify Resistance Levels
Resistance forms around areas where upward price movements have repeatedly lost momentum.
If a cryptocurrency rises toward a particular price several times and then declines, that area may represent resistance.
Repeated rejection can make the zone more important because it suggests sellers have consistently appeared there.
Trading volume can also provide useful confirmation when analyzing resistance.
Just like support, resistance should generally be viewed as a zone rather than a perfectly precise price.
Support and Resistance Can Switch Roles
One of the most important ideas to understand is that support and resistance can change places.
Suppose a cryptocurrency repeatedly struggles to move above a resistance level. Eventually, strong buying pressure pushes the price through that barrier.
If the breakout holds, the old resistance area may later become support.
The opposite can happen when support breaks. A level that previously attracted buyers may become resistance when price returns to it.
This role reversal occurs because market expectations change after a significant breakout or breakdown.
Trading Bounces From Support
Some traders look for buying opportunities when price approaches an established support zone.
However, simply touching support doesn’t automatically mean that price will rise.
A more cautious approach is to wait for evidence that buyers are actually defending the area. This might include a bullish candlestick formation, increased volume, or a shift in short-term market structure.
Waiting for confirmation can reduce the risk of entering a trade just before support breaks.
This approach can be particularly useful when the market is moving sideways between clearly defined support and resistance zones.
Trading Rejections at Resistance
Resistance can also provide potential trading opportunities.
When price reaches a well-established resistance zone and begins showing signs of weakness, some traders may consider taking profits or, where appropriate, looking for short-selling opportunities.
Confirmation is important because strong buying pressure can push price straight through resistance.
Bearish candlestick formations, weakening momentum, or declining buying volume may provide additional evidence that the market is struggling to move higher.
Still, no resistance level guarantees a reversal.
Trading Breakouts
Breakout trading focuses on situations where price moves decisively beyond an established support or resistance zone.
A move above resistance can indicate that buyers have gained enough strength to push the market into a new price range.
A move below support may suggest that sellers have taken control and that a downward trend could develop.
Some traders wait for the candle to close beyond the level and look for stronger volume before entering a breakout trade.
This can help filter out some weak or temporary moves.
Recognizing False Breakouts
Breakouts don’t always lead to new trends.
Sometimes price briefly moves above resistance, attracts buyers, and then quickly falls back below the level. The same thing can happen when price briefly breaks support before recovering.
These moves are known as false breakouts.
They can be particularly dangerous because traders may enter positions expecting a strong continuation that never develops.
Waiting for confirmation, such as sustained price movement, increased volume, or additional technical signals, can help reduce the risk of getting caught in a false breakout.
Patience is often more valuable than being the first trader to enter.
Combining Support and Resistance With Technical Indicators
Support and resistance can become more useful when they are combined with other forms of technical analysis.
Moving averages can help traders determine the broader trend.
The Relative Strength Index can provide clues about momentum and potentially overbought or oversold conditions.
MACD can help identify changes in momentum and trend strength.
Candlestick patterns can offer additional evidence that buyers or sellers are becoming more active around an important price zone.
The goal isn’t to fill a chart with as many indicators as possible. Instead, traders should use a small number of complementary tools that provide meaningful confirmation.
Support and Resistance Across Different Time Frames
Important price levels appear across virtually every chart time frame.
Weekly and monthly charts can reveal major support and resistance areas that have influenced price over longer periods.
Daily and four-hour charts can help traders identify medium-term market structure.
Shorter time frames are often used to refine entries and exits.
A common approach is to begin with a higher time frame to understand the broader market structure and then move to lower time frames when looking for a specific trading setup.
This can help traders avoid making decisions based entirely on short-term market noise.
Risk Management Around Key Levels
Support and resistance can also play an important role in risk management.
For example, a trader buying near support might consider placing a stop-loss below the area if the trade setup becomes invalid when support fails.
Likewise, a trader selling near resistance may consider a stop-loss above the resistance zone.
The exact placement depends on the strategy, volatility, and market conditions.
Position size is equally important. A wider stop-loss generally requires a smaller position if the trader wants to maintain the same level of account risk.
Good analysis means little without proper risk control. Protecting trading capital should always come first.
Common Mistakes Beginners Make
One of the biggest mistakes beginners make is treating support and resistance as exact prices.
Markets rarely react with perfect precision. Price may move slightly beyond a level before reversing.
Another mistake is entering a trade immediately when price reaches support or resistance without waiting for confirmation.
Some traders also ignore the broader trend, trading against strong market momentum simply because price has reached a particular level.
News events can create another problem. Major announcements can cause price to break through established levels unexpectedly.
Finally, traders sometimes become emotionally attached to a particular level even after the market has clearly changed.
Good traders remain flexible and update their analysis when new information appears.
Best Practices for Using Support and Resistance
Improving your ability to identify these levels takes practice.
Spend time studying historical charts and mark areas where price repeatedly reacted. Look at what happened before and after each reaction and consider whether volume, market structure, or other indicators provided confirmation.
Before risking real money, traders can also test their ideas using historical data or a demo account.
Keeping a trading journal is another useful habit. Record the support and resistance levels you identified, why you entered a trade, where you placed your stop-loss, and what happened afterward.
Over time, this record can reveal which setups work best for your trading style.
Support and Resistance in Different Market Conditions
The effectiveness of support and resistance can change depending on the market environment.
During a strong bull market, resistance levels may be broken more frequently because buyers remain aggressive. Previous resistance can then become new support as the upward trend continues.
During a bear market, support levels may fail more often because selling pressure remains dominant. Former support zones can subsequently become resistance.
In a sideways market, support and resistance can become particularly useful because prices repeatedly move between established boundaries.
Understanding whether the market is trending upward, trending downward, or moving sideways helps traders interpret these levels more accurately.